AI Adoption in HR & IT Benchmark: What 15 months of production data actually reveals
Survey-based State of AI content dominates the enterprise AI conversation, and it measures what it measures well: sentiment and budget intent. This benchmark measures something else, drawing on 15 months of production usage from Druid’s employee-facing HR and IT deployments. It shows where employee demand actually lands and which experiences carry the volume once AI agents go live in real service journeys.
That gap matters if you’re the one evaluating. You need a reference point: where does employee demand concentrate, which channels drive adoption, how often do users stay inside self-service, and where does human handoff still matter?
The benchmarks below cover that operational reality. Every figure is a percentage share, so you can compare shape rather than raw counts.
INSIGHT 01
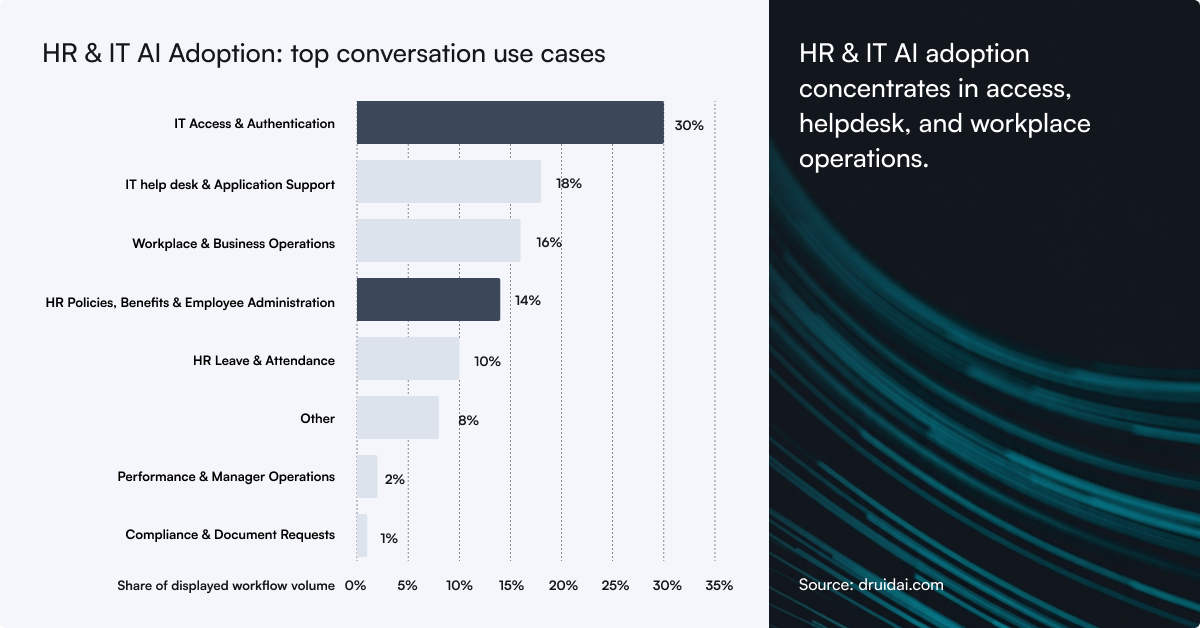
AI adoption in HR & IT concentrates in access, helpdesk, and workplace operations
IT Access & Authentication accounts for 30% of workflow volume. In practice that means system access requests, login help, account access, and password resets. IT Help Desk & Application Support adds 18%, Workplace & Business Operations another 16%. Those three categories carry 64% of everything in the benchmark.
HR Policies, Benefits & Employee Administration and HR Leave & Attendance contribute a further 24% combined. Demand spans both HR and IT operations, well beyond generic helpdesk work.
Adoption starts where friction is highest. Employees want a faster way to get unstuck without wading through knowledge bases and ticket queues. AI agents fit this layer because they can interpret intent, pull approved guidance, kick off governed workflows, and escalate exceptions with context. An everyday request becomes a completed action instead of an abandoned search or another ticket.
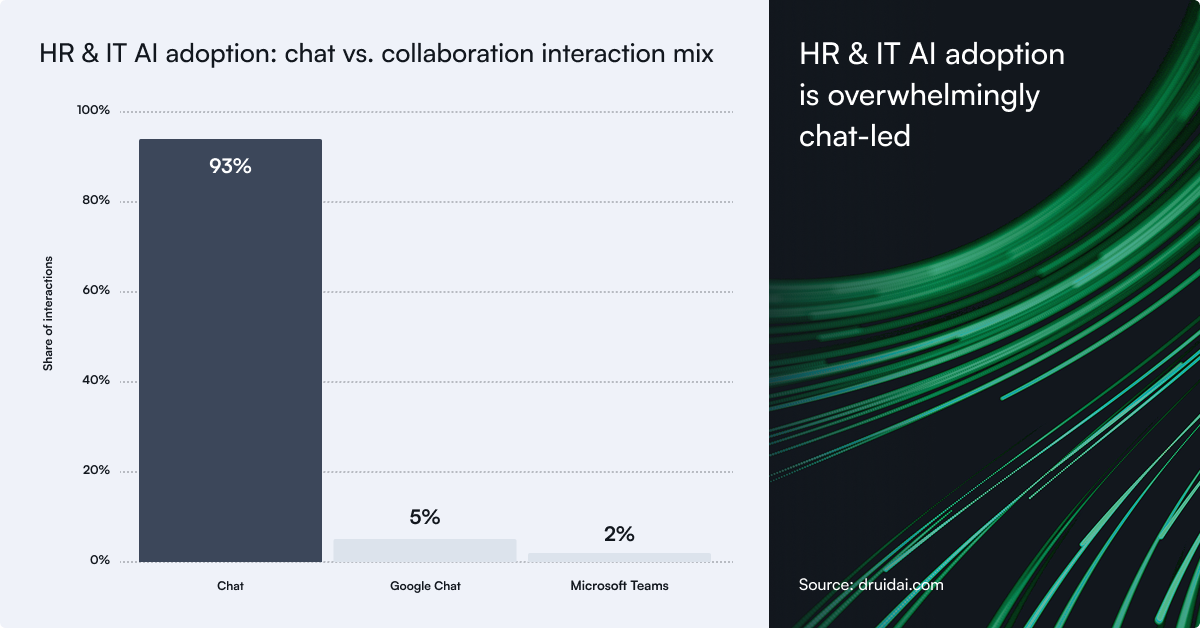
Chat accounts for 93% of engaged HR & IT interactions. Employees ask for help, trigger a workflow, or get routed to the right next step without filling out a ticket form first. Collaboration tools add reach, but the dominant model is chat-first employee service.
Why chat? It’s fast and familiar. The value, though, comes from what happens after the first message: the agent authenticates the employee, pulls the right policy or record, completes the workflow, creates a ticket, routes an approval, or hands off to a human with full context. A chat that ends in a completed action is a very different product from a chatbot that answers questions.
INSIGHT 03
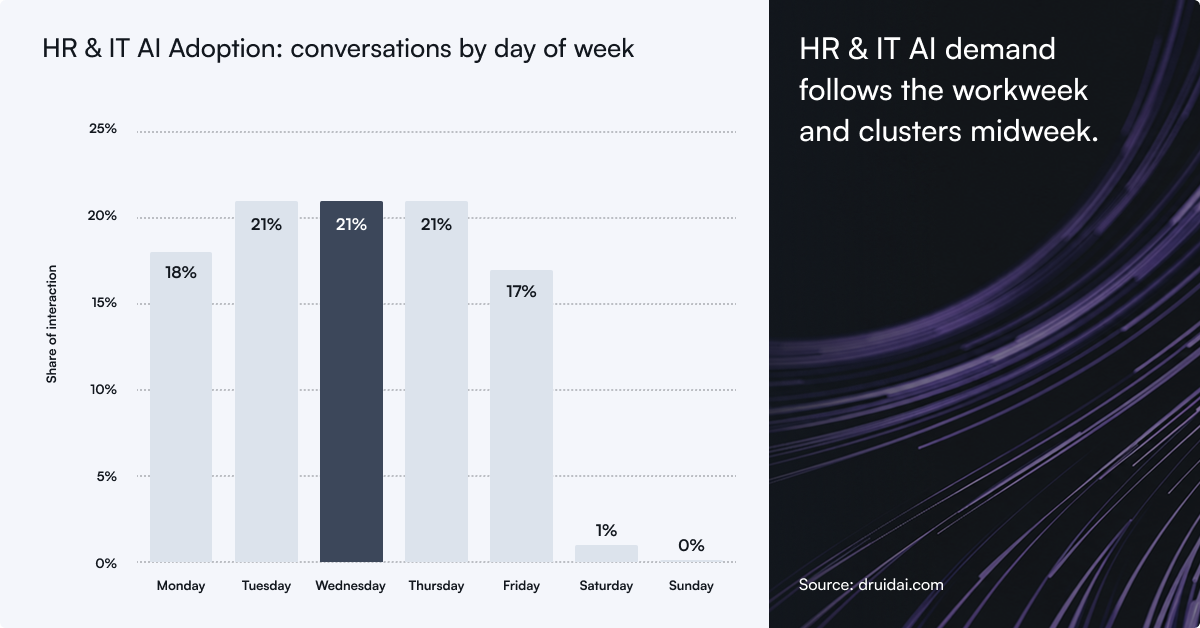
HR & IT AI demand follows the workweek and clusters midweek
Monday through Friday carries 98% of total interactions; weekends get the remaining 2%. The middle of the week is heaviest. Tuesday, Wednesday, and Thursday each account for 21% of activity, or 63% combined.
That concentration tells you what role these agents actually play. They absorb demand when organizations run at full speed, which is also when service desks are most stretched. Employees resolve routine requests without waiting in a queue, and HR and IT teams keep their capacity for judgment-heavy work.
INSIGHT 04
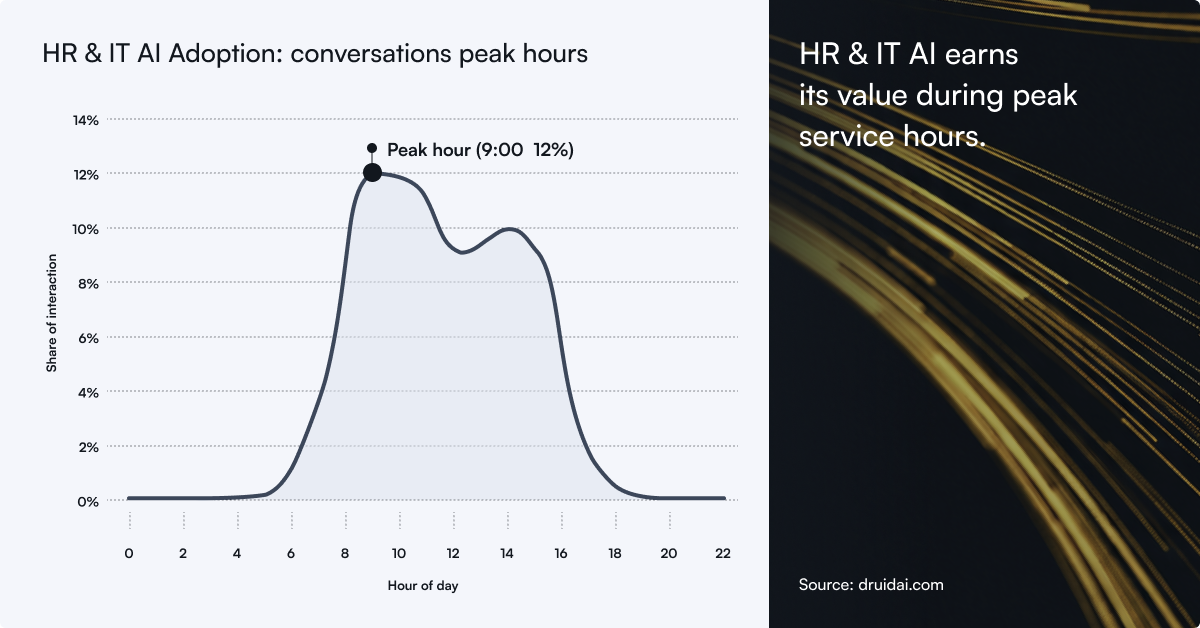
HR & IT AI earns its value during peak service hours
94% of interactions land between 8 AM and 5 PM. The busiest hour is 9 AM, at 12% of daily volume; the 9 and 10 AM hours together account for 24%. The remaining 6% arrives outside business hours.
That timing shapes the business case. A password reset or an access request at 9 AM can delay a meeting or block a project before the day has fully started. Absorbing that morning peak, when queues form fastest, is where the value concentrates. After-hours coverage is real, but it’s the smaller share.
INSIGHT 05
Most HR & IT AI demand stays contained, while escalation protects governed work
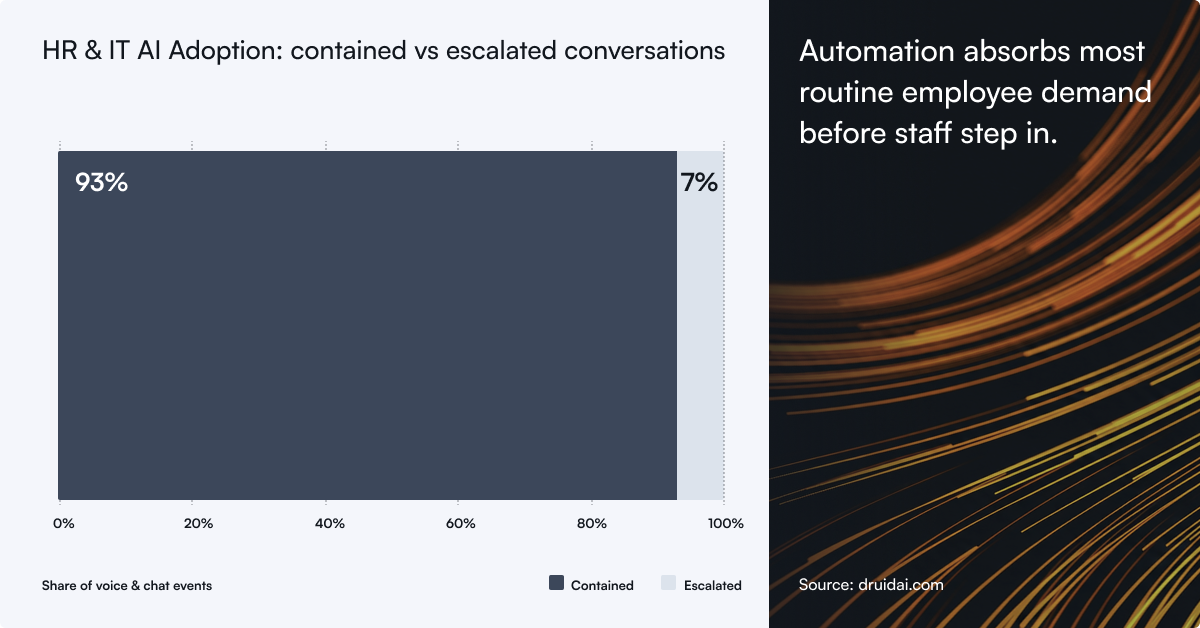
Contained events make up 93% of the HR & IT benchmark; escalations account for 7%. An escalation often means the system worked as designed. In employee support journeys, business rules deliberately bring in HR, IT, security, or service-desk staff for approvals, policy exceptions, access reviews, employee relations issues, and live troubleshooting.
The 93% says routine demand resolves automatically. The 7% says governed workflows still route sensitive work, approvals, and edge cases to people. Both numbers are doing their job.
What this means for HR & IT leaders evaluating AI solutions.
Production telemetry points to an employee-support operating model grounded in real usage rather than survey intent.
The shape is consistent across all five benchmarks. Employees begin these journeys in chat, with collaboration surfaces extending reach. Workflow value concentrates in practical service work: access requests, helpdesk and application support, workplace operations, HR administration, and leave workflows. Usage follows the workweek, peaks during business hours, and stays mostly contained, with escalation reserved for governed exceptions.
Taken together, that describes a capacity layer for shared services, and it’s already carrying part of the operating model. The evaluation question that matters: can the platform turn employee requests into completed, governed actions at this volume?
Methodology
Source: anonymized aggregate usage data from Druid's HR & IT / Employee Experience production deployments from Jan 2025 to March 2026.
Normalization: every visual expresses share of the relevant total as a percentage, rather than showing raw counts.
Get your copy of the 2026 AI Adoption Benchmark report
Download the PDF report to explore what 15 months of HR & IT production AI agent usage reveals about real-world adoption, service demand, and resolution.